
Inflation in the Philippines eased slightly in August, but the country’s lowest-income households did not get the same degree of relief.
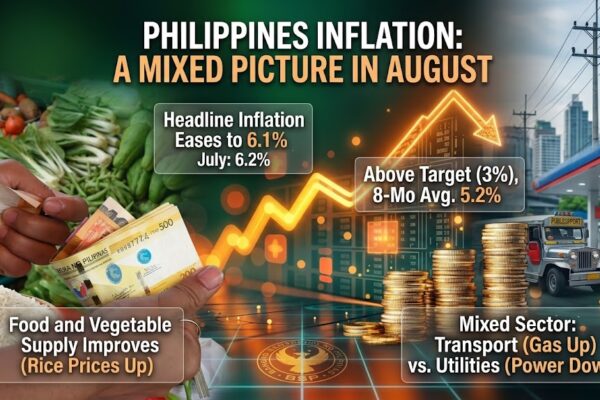
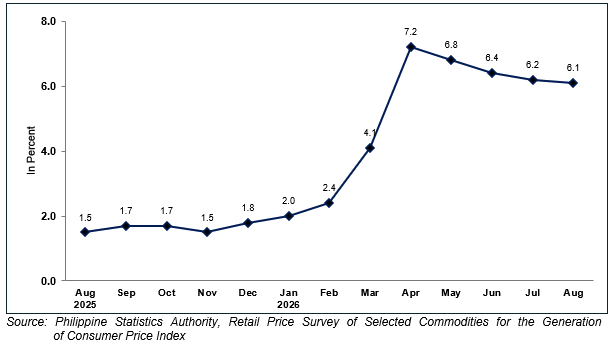
Headline inflation slowed to 6.1% in August from 6.2% in July, according to the Philippine Statistics Authority’s August inflation report. For households belonging to the bottom 30% income group, however, inflation stayed at 8.2%, leaving them with a rate 2.1 percentage points above the national figure.
The difference helps explain why a decline in the headline inflation rate does not necessarily translate into the same experience for every Filipino household.
Lower-income families spend their money differently from the average household represented by the headline Consumer Price Index. The PSA therefore maintains a separate CPI for the bottom 30%, with its own market basket and expenditure weights designed to reflect what those households commonly buy.
The same necessities are rising faster for poorer households
The gap becomes clearer when the major spending categories are compared.
For bottom-30% households, prices of food and non-alcoholic beverages rose 8.0% year on year in August, based on the PSA’s August CPI report for the bottom 30% income households. The corresponding increase in the national CPI was only 4.6%.
Housing, water, electricity, gas and other fuels increased 10.3% for the bottom 30%, compared with 7.9% across all income households.
Transport showed an even sharper increase. Transport inflation among bottom-30% households accelerated to 15.3% from 14.2% in July. The national transport index also accelerated, but from a lower base, rising to 13.5% from 11.9%.
These are not peripheral expenses. Food, shelter, utilities and transportation are categories that households have limited ability to avoid entirely.
For lower-income consumers, faster increases in these necessities can therefore have a much bigger effect on a household budget than falling inflation in less essential spending categories.
Why can there be two different inflation rates?
The CPI is not simply an average of every price increase in the country.
Instead, the PSA tracks a market basket of goods and services and assigns different weights depending on how much households typically spend on each category.
For the bottom 30%, PSA uses a separate basket and weighting system based on the consumption patterns of lower-income households. The weights are derived from expenditure information collected through the Family Income and Expenditure Survey and are reflected in the agency’s separate CPI tables for bottom-30% households.
That means a price increase in something a low-income household spends heavily on can have a greater effect on its CPI than a similar increase in a category that takes up a smaller part of its budget.
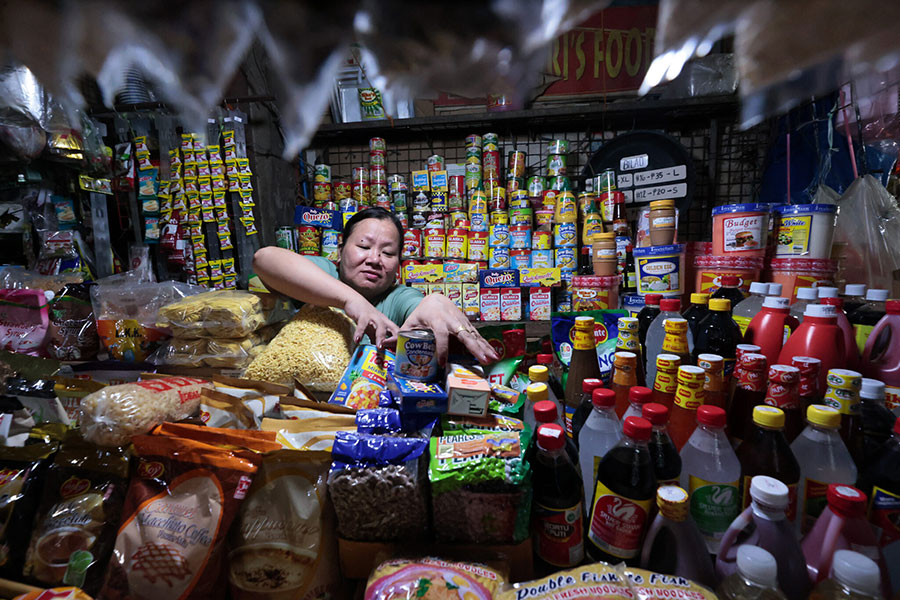
August’s numbers show this clearly.
Food and non-alcoholic beverages accounted for 52.5% of the total inflation recorded for bottom-30% households, contributing about 4.3 percentage points to their 8.2% rate.
Housing and utilities contributed another 1.6 percentage points, while transport contributed around one percentage point.
Those figures are contribution shares, rather than the underlying CPI expenditure weights. But they show how heavily increases in essential expenses shaped inflation for poorer households during the month.
Food inflation tells an even sharper story
Looking specifically at food rather than the wider food-and-non-alcoholic-beverages category, inflation for bottom-30% households was 8.3% in August, down slightly from 8.5% in July.
For all income households, food inflation was only 4.6%, according to the PSA’s separate August inflation releases.
Rice was among the products still putting upward pressure on prices.
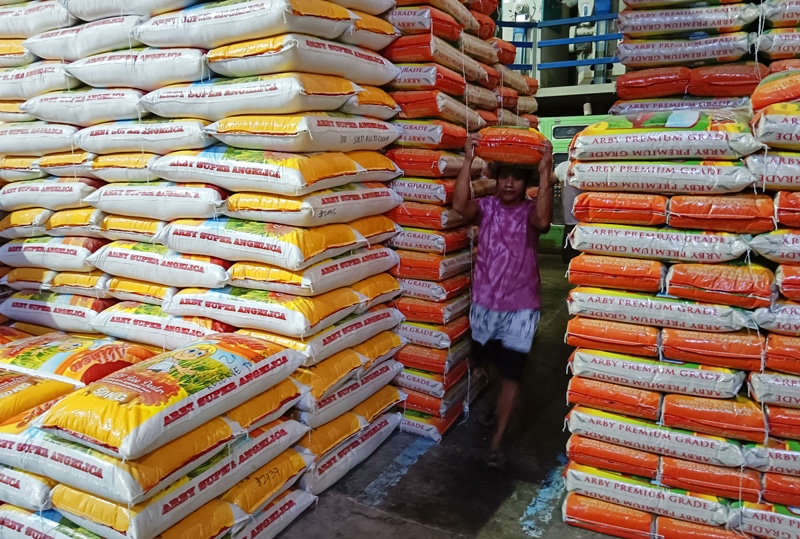
Rice inflation for the bottom 30% accelerated to 22.5% in August from 19.3% in July. Across all income households, rice inflation also increased, but at a lower 19.4% from 17.1%.
Some food items did provide relief. Inflation in vegetables, tubers, plantains, cooking bananas and pulses slowed substantially for lower-income households, while increases in corn, fish and oils and fats also moderated.
But those declines were not enough to bring the overall bottom-30% inflation rate below 8.2%.
Outside Metro Manila, the gap is even wider
Geography adds another layer.
Inflation among bottom-30% households in the National Capital Region slowed to 4.3% in August from 4.5% in July.
Outside NCR, however, it edged higher to 8.4% from 8.3%. Ten regions outside Metro Manila recorded faster bottom-30% inflation during the month, with Davao Region posting the highest rate at 12.1%, according to the PSA’s regional breakdown.
For all income households, inflation outside NCR stood at 6.6%, compared with 4.1% in Metro Manila.
The data therefore point to two overlapping gaps: lower-income households are experiencing faster price increases than the national average, while poorer households outside Metro Manila are facing particularly elevated inflation.
Slower inflation does not mean lower prices
There is also a simpler point that often gets lost whenever headline inflation falls.
A decline from 6.2% to 6.1% does not mean prices went down. It means the overall price level increased at a slightly slower annual rate.
For the bottom 30%, even that slowdown did not happen in August. Their inflation rate remained at 8.2%.
So while the national CPI shows that overall inflation has eased slightly, the August numbers also show that the improvement is uneven.
For households with the least room in their budgets, many of the prices that matter most are still rising considerably faster.